1 Minute Nifty Scalping Strategy
Fast Profits with Precise Entries & Exits | Rajkamal Stock Options
Ultimate Scalping Strategy for Nifty 1-Minute Charts
This strategy is designed for traders who want to capitalize on quick movements in the Nifty index using 1-minute charts. The approach combines price action, volume analysis, and simple indicators for high-probability trades.

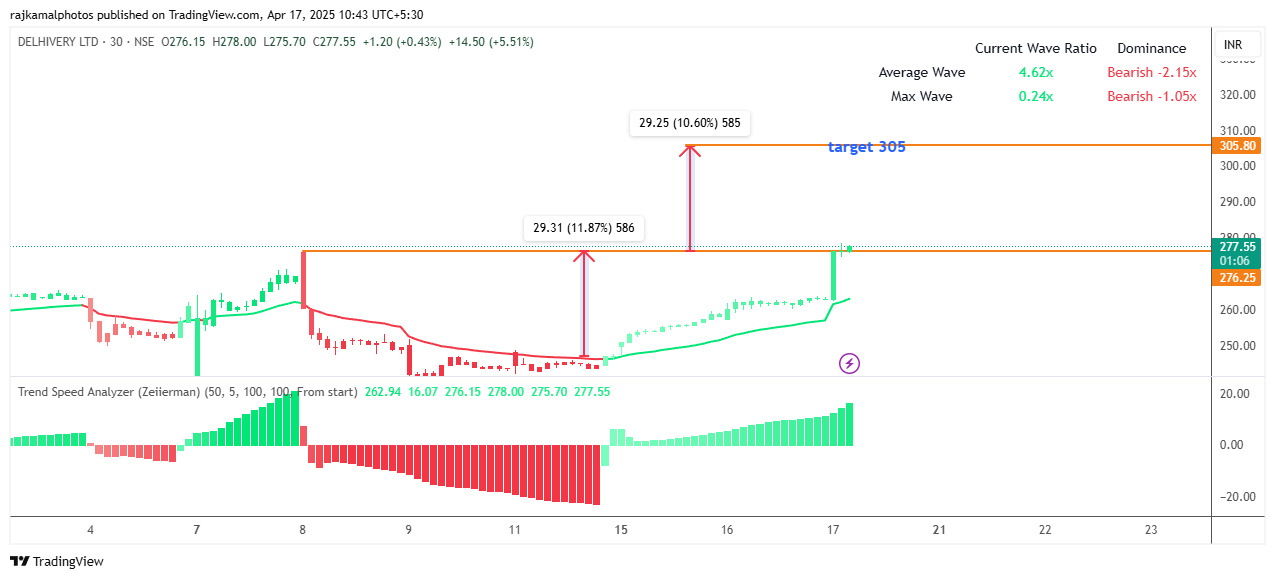
Sample 1-minute Nifty chart showing scalping opportunities
Key Advantages of This Strategy:
- Requires only 1-2 hours of trading time per day
- Works best in the first hour of market opening (9:15-10:15 AM)
- Average 5-10 points profit per trade
- Uses simple indicators for easy decision making
- Effective in both trending and range-bound markets
Strategy Rules in Tabular Format
| Condition | Entry Signal | Exit Signal | Stop Loss | Risk-Reward |
|---|---|---|---|---|
| Bullish Setup Price above 20 EMA |
Price breaks high of previous candle with increased volume | Price closes below 5 EMA OR 5-point profit target | Low of entry candle | 1:1.5 minimum |
| Bearish Setup Price below 20 EMA |
Price breaks low of previous candle with increased volume | Price closes above 5 EMA OR 5-point profit target | High of entry candle | 1:1.5 minimum |
| Range Setup Price between 20 EMA and VWAP |
Price bounces from support/resistance with volume confirmation | Opposite side of range OR 3-point profit | Beyond range boundary | 1:1 minimum |
| Breakout Setup After consolidation |
Price breaks consolidation with 2x average volume | Volume dries up OR 8-point profit | Mid-point of consolidation | 1:2 minimum |
| Pullback Setup In strong trend |
Price retraces to 5 EMA in downtrend with reducing volume | Price moves beyond entry candle extreme | Beyond 8 EMA | 1:3 potential |

Breakout example on 1-minute Nifty chart
Indicator Settings for 1-Minute Scalping
| Indicator | Settings | Purpose | Signal |
|---|---|---|---|
| 5 EMA | 5-period Exponential Moving Average | Short-term trend direction | Price above = bullish bias, below = bearish bias |
| 20 EMA | 20-period Exponential Moving Average | Intraday trend filter | Primary trend direction |
| Volume | Standard volume bars | Confirmation of moves | Breakouts need 2x average volume |
| VWAP | Volume Weighted Average Price | Mean reversion level | Price above = bullish, below = bearish |

Indicator signals on 1-minute chart
Daily Profit Targets & Risk Management
| Account Size | Daily Target | Max Loss | Typical Trades/Day | Success Rate |
|---|---|---|---|---|
| ₹50,000 | ₹1,500-2,000 | ₹1,000 | 3-5 | 65-70% |
| ₹1,00,000 | ₹3,000-4,000 | ₹2,000 | 4-6 | 65-70% |
| ₹2,00,000+ | ₹5,000-7,000 | ₹3,000 | 5-8 | 60-65% |
Important Risk Management Rules:
- Never risk more than 1% of capital on a single trade
- Stop trading after 2 consecutive losses
- Avoid trading during news events and first 5 minutes after market open
- Reduce position size by 50% when market volatility is high (VIX > 20)
- Always use hard stop losses - no mental stops!